Inside this article :
Here’s the crisis that nobody talks about: 29.6% of platform engineering teams don’t measure any type of success at all. Another significant percentage measure only infrastructure metrics—build times, deployment frequency, uptime. They’ve optimized for the wrong outcomes.
Meanwhile, Gartner forecasts that 80% of organizations will establish dedicated platform teams by 2026. Billions of dollars are being invested in internal developer platforms, yet most organizations lack language to articulate platform value to executives, justify continued investment, or course-correct when platforms aren’t delivering expected benefits.
This is the measurement crisis. Without proper metrics, platform investments become expensive infrastructure projects that executives can’t defend. With proper measurement, platforms become strategic investments that drive competitive advantage. The difference between these outcomes is measurement discipline and understanding what actually matters.
The Measurement Crisis: Why Most Organizations Get It Wrong
Platform engineering teams face a fundamental challenge: they’re caught between two measurement worlds. Traditional DevOps metrics—DORA, deployment frequency, change failure rate—reveal what happened, not why productivity improved or declined. These infrastructure metrics miss the human experience entirely.
Consider this scenario: Your platform team optimizes CI/CD pipelines, reducing build time from 10 minutes to 3 minutes. Infrastructure metrics improve. Executives celebrate. Yet developers still feel slow. Why? Because they’re blocked waiting for code reviews, or spending hours on manual test configuration, or context-switching between tools. The platform solved one problem while missing the actual bottleneck.
Organizations measuring only infrastructure metrics optimize for the wrong outcomes. They might:
- Speed up CI/CD while missing that developers are blocked waiting for security reviews
- Adopt AI tools while missing that those tools increase cognitive load for certain tasks
- Reduce build times while missing that context switching is the real constraint on throughput
- Increase deployment frequency while missing that quality and reliability have degraded
The measurement crisis persists because most organizations lack a dual view: system performance metrics and the human conditions that enable developers to do their best work.
Framework 1: DORA Metrics—The Industry Standard (But It’s Not Enough)
DORA metrics lead as the most widely adopted framework (40.8%), followed by time to market (31.0%), and SPACE metrics for developer productivity (14.1%). DORA is foundational, but let’s understand what it actually measures.
DORA Metrics Overview
Deployment Frequency: How often you deploy to production. Healthy platforms enable multiple deployments daily. Stagnant platforms show monthly or quarterly cycles.
Lead Time for Changes: Time between code commit and deployment. Mature platforms measure this in hours; immature platforms measure in weeks.
Change Failure Rate: Percentage of deployments causing failures in production. Elite performers maintain sub-1% failure rates.
Mean Time to Recovery (MTTR): How long it takes to restore service after a failure. This matters more than preventing failures—it measures resilience.
DORA metrics are valuable precisely because they’re objective and measurable. They create a common language across organizations. However, they tell only part of the story. You can have excellent DORA metrics while developers experience friction, cognitive overload, and dissatisfaction.
Framework 2: SPACE Metrics—Measuring Developer Experience Dimensions
SPACE metrics address the human side of platform engineering. Rather than focusing on velocity alone, SPACE measures five dimensions of developer experience:
Satisfaction
Developer happiness tracked through quarterly surveys. Higher satisfaction correlates with better retention—and replacing a senior developer costs significant resources. Track satisfaction before and after platform rollout to quantify impact.
Performance
Code quality and system reliability measured through code review metrics, test coverage, and production incident rates. Platforms that enforce quality standards at build time significantly improve performance metrics.
Activity
Concrete actions like pull requests, code reviews, and deployments. High activity with low stress indicates healthy productivity. Low activity with high stress signals bottlenecks your platform should address.
Efficiency
Workflow smoothness and reduced context switching. Measure through “time in flow” surveys and interruption frequency. Platforms that provide self-service capabilities eliminate wait times, letting developers stay in flow state longer. Flow time matters more than raw activity.
Communication
Ease of sharing information and reducing fragmentation. Platforms that centralize documentation and reduce tool sprawl improve communication efficiency and knowledge distribution across teams.
The Business Metric That Executives Understand: Time to Market
While DORA captures delivery mechanics and SPACE captures experience dimensions, time to market captures business velocity—the metric executives care about most.
Time to market measures the complete journey from concept to production-ready feature. A platform that cuts feature delivery from 8 weeks to 3 weeks enables 2.5x more features annually, which is a strategic advantage executives understand immediately. Faster time to market means your organization can respond to competitive threats, capitalize on market opportunities, and adapt to customer feedback in weeks rather than quarters.
This is where platform value becomes undeniable. When you connect platform investments to time-to-market improvements, the business case becomes self-evident.
The AI Measurement Problem: Perceived Gains vs. Measured Gains
As AI tools proliferate in developer workflows, a new measurement challenge emerges. Research shows daily AI users achieve 16% higher throughput than non-users. However, perceived gains often exceed measured gains. Task-model fit determines whether AI helps or creates friction. System-level thinking wins—the greatest AI productivity gains come from addressing bottlenecks in the value stream, not just individual task acceleration.
Organizations adopting AI without proper measurement infrastructure often discover:
- AI tools increase throughput on individual tasks but create new coordination bottlenecks
- AI code generation accelerates initial coding but increases testing burden and review complexity
- AI tools introduce new cognitive load in tool selection and result validation
- Perceived productivity gains (developers feel faster) diverge from measured outcomes
The platform engineering challenge in 2026 is measuring whether AI genuinely improves developer effectiveness across entire value streams, not just individual tasks.
Critical Insight: AI amplifies existing practices, both good and bad. Combining human and system data reveals where friction exists and where improvements will have greatest impact. Platform teams that measure both adoption patterns and outcome metrics identify where AI meaningfully improves results versus creating new friction.
What Platform Teams Should Actually Measure in 2026
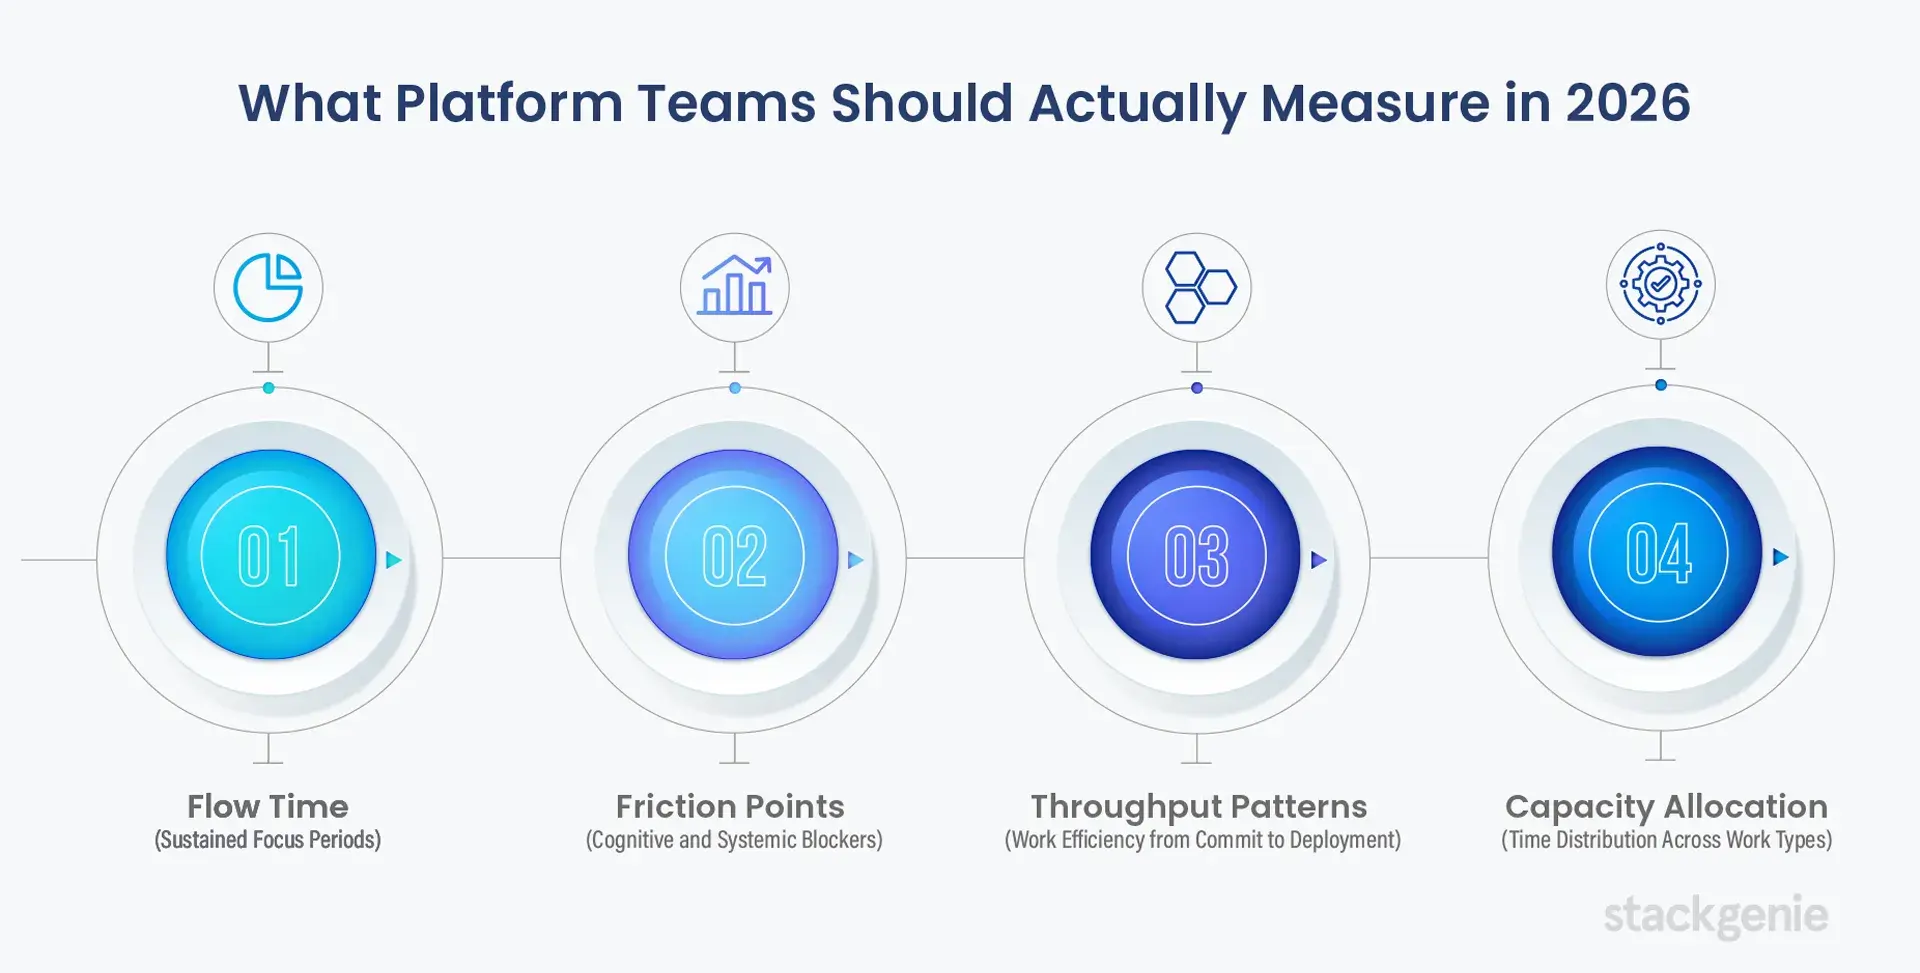 Stop measuring activity. Start measuring conditions that enable effectiveness. Here’s what matters:
1. Flow Time (Sustained Focus Periods)
How much uninterrupted time do developers actually spend on feature work? Track this through calendar analysis and developer surveys. Most organizations discover that developers spend less than 2-3 hours daily on actual feature development—the rest is meetings, reviews, context switching, and waiting. Platforms that increase flow time dramatically improve outcomes.
2. Friction Points (Cognitive and Systemic Blockers)
Where do developers encounter delays, tool complexity, unclear processes, or handoffs? Use experience sampling surveys to identify friction. Then measure whether platform investments reduce specific friction points. Example: “Time spent resolving environment setup issues” should drop from 4 hours to 15 minutes after infrastructure platform deployment.
3. Throughput Patterns (Work Efficiency from Commit to Deployment)
Beyond DORA metrics, measure the complete value stream. From code commit to feature in production, what percentage of time is actual work versus waiting? Where do bottlenecks accumulate? This system-level view reveals where platform improvements have highest impact.
4. Capacity Allocation (Time Distribution Across Work Types)
What percentage of developer time goes to feature work, maintenance, unplanned work, and toil? Track this over time. Mature platforms should steadily increase feature work percentage while decreasing toil percentage. This metric directly connects platform value to business outcomes.
Proving Platform Value to Executives
Executives don’t care about DORA metrics or SPACE scores. They care about:
- Time to market:How fast can we deliver features customers want?
- Developer retention:Are we losing talent to competitors offering better DevEx?
- Engineering efficiency:What percentage of developer time creates business value?
- Cost per deployment:What’s the infrastructure and human cost to ship features?
- Quality and reliability:Are we shipping safer software faster?
Connect every platform metric back to these business outcomes. Don’t say “We reduced deployment frequency to 5 per day.” Say “We enable developers to ship features twice as fast, cutting time to market from 8 weeks to 4 weeks. This allows us to respond to market changes 2x faster than competitors.”
The Road Forward: Building Measurement Infrastructure
Organizations implementing platform engineering strategies in 2026 must invest in measurement infrastructure alongside technical infrastructure. This means:
- Implement DORA metrics collection through your CI/CD pipeline (this is table stakes)
- Conduct quarterly SPACE surveys to track developer experience dimensions
- Measure time to market from business requirement to feature in production
- Track flow time and friction points through developer surveys and calendar analysis
- Monitor capacity allocation to measure whether platforms actually reduce toil
- Connect all metrics to business outcomes that executives understand and care about
29.6% of organizations don’t measure platform success at all. Don’t be one of them. Another significant percentage measure only infrastructure metrics and miss the human experience entirely. Be the organization that understands platform value through rigorous, multidimensional measurement.
Conclusion: Measurement Discipline Creates Platform Success
Platform engineering investments are only as good as your ability to measure and communicate their value. Organizations that measure both infrastructure performance and developer experience, that connect metrics to business outcomes, and that iterate based on data will successfully justify continued platform investment and maintain momentum.
Those that measure only activity, or don’t measure at all, will struggle to defend ongoing investment and fail to identify where platforms are missing the mark. The measurement crisis isn’t a data problem—it’s a strategic discipline problem. Organizations that solve it will be the ones capturing competitive advantage through platform engineering in 2026 and beyond.
Ready to Measure Your Platform Engineering Value?
StackGenie helps organizations design measurement frameworks, implement DORA and SPACE metrics collection, and connect platform investments to business outcomes. Let’s build your measurement infrastructure and prove platform value.
Let's Measure Your Platform Impact?
Contact Us NowFrequently Asked Questions
1. How do you measure platform engineering success in 2026?
Platform engineering success in 2026 is measured using a combination of DORA metrics, developer experience (DevEx) frameworks like SPACE, and business metrics such as time to market. Organizations must track both system performance and human productivity to get a complete view of platform impact.
2. What are DORA metrics and why are they important?
DORA metrics include deployment frequency, lead time for changes, change failure rate, and mean time to recovery. They are important because they provide standardized, objective insights into software delivery performance, helping teams benchmark and improve engineering efficiency.
3. What is the SPACE framework in platform engineering?
The SPACE framework measures developer productivity across five dimensions: satisfaction, performance, activity, communication, and efficiency. It helps organizations understand the human side of engineering, ensuring that productivity improvements don’t come at the cost of developer experience.
4. Why is developer experience (DevEx) critical for platform success?
Developer experience directly impacts productivity, retention, and overall engineering output. Poor DevEx leads to friction, delays, and burnout, while a strong developer experience enables faster delivery, better code quality, and higher team satisfaction.
5. What is time to market and how does it relate to platform engineering?
Time to market measures how quickly a feature moves from idea to production. In platform engineering, reducing time to market demonstrates real business value by enabling organizations to respond faster to customer needs and market changes.
6. Why do organizations struggle to measure platform ROI?
Many organizations focus only on infrastructure metrics like build time and deployment frequency, ignoring human factors such as cognitive load and workflow friction. This incomplete view makes it difficult to connect platform investments to real business outcomes.
7. How does AI affect developer productivity measurement?
AI tools can improve developer throughput and automate repetitive tasks, but they may also introduce new complexities such as increased review effort and cognitive load. Measuring AI impact requires evaluating both perceived productivity and actual end-to-end outcomes.