Blog Image
Deploying Prometheus Operator (Helm) On AKS Cluster
10 November 2022

Deploying Prometheus Operator (Helm) On AKS Cluster

What is an Operator?

A Kubernetes Operator is a software component that extends the Kubernetes platform to manage specific types of applications and their underlying infrastructure. Operators provide a high-level and abstract way to manage the entire application stack, including deployment, scaling, upgrades, and maintenance of the application components. By encapsulating the operational knowledge of a specific application into a reusable package, operators simplify the deployment and management of complex applications within a Kubernetes environment.

Operators are custom controllers that watch the changes in the state of the application and take necessary actions to keep the application running as expected, providing a declarative interface for managing the application and ensuring a desired state is achieved. Kubernetes natively doesn’t have the knowledge required to automate the process of deploying every single stateful application, Operator custom CRD’s will extend Kubernetes API to overcome this issue.


Prometheus Operator:

The Prometheus Operator is a software component that extends the Kubernetes platform to manage Prometheus, an open-source monitoring and alerting system. The Prometheus Operator provides a simple and easy way to deploy, configure, and manage Prometheus instances within a Kubernetes cluster.

Why Prometheus Operator?

With the use of Prometheus Operator, users can automate the deployment and management of Prometheus instances, reducing the time and effort required to configure and maintain monitoring for their applications. The Prometheus Operator also provides built-in support for features such as rolling updates, scaling, and backup and restore, making it easier for users to ensure that their monitoring systems are reliable and scalable.

Why Observability and Monitoring?

Monitoring focuses on predefined metrics to identify when a specific platform or application is performing within expectations. The metrics tracked generally focus on things like resource utilisations.

Observability combines metrics, logs and traces a specialised form of logging to instrument applications in a way that makes it simpler to troubleshoot issues without having to rely solely on a limited set of metrics that have been pre-defined to monitor a specific process or function. Observability provides proactive prevention with the help of collected metrics.


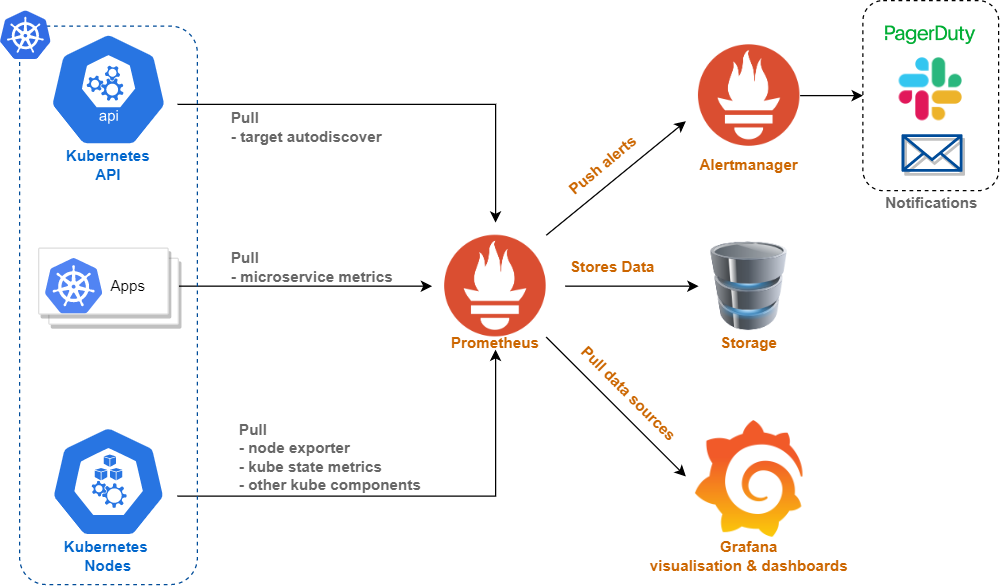
Prometheus Architecture:


Setting Up Prometheus Helm Operator:

Deploying Prometheus Operator and kube-prometheus in an Azure Kubernetes Service (AKS) cluster using Prometheus operator Helm.

  • Pre-requisites:
    • Azure Account
    • AKS Cluster
    • Install Azure CLI
    • Get the Kube Context file
    • Install Helm package


    1. To add the Prometheus chart repository to Helm, utilise the following command:


 $ helm repo add prometheus-community https://prometheus-community.github.io/helm-charts 


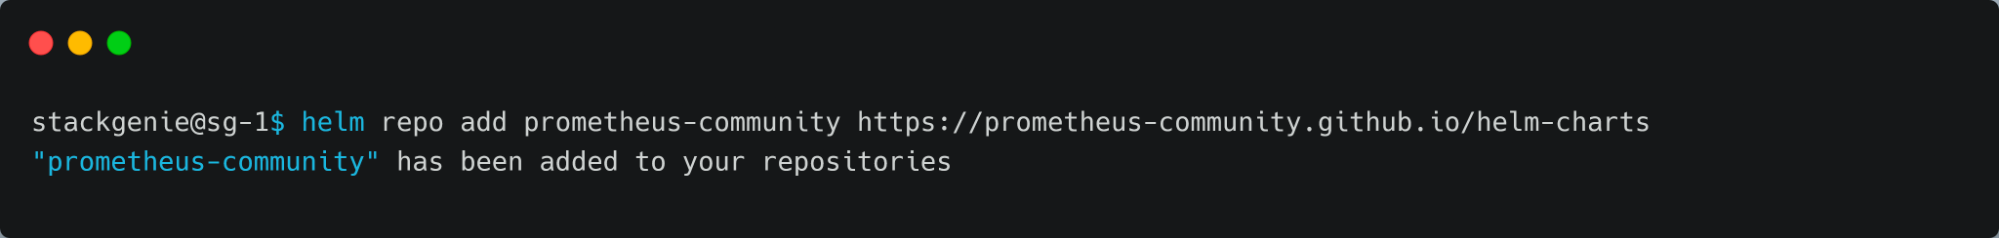
    1. Install the Prometheus Operator Helm chart onto the AKS Cluster:


$ helm install prometheus prometheus-community/kube-prometheus-stack --namespace monitoring --create-namespace


    1. Use the “helm list” command to display a list of deployed Helm charts:


$ helm list --all-namespaces

Let’s examine all the Kubernetes components that are deployed with the Prometheus Operator Helm chart.


  • Retrieve the pods within the monitoring namespace:


$ kubectl get pods --namespace monitoring 

Note: The componentes that have “-operator-” in their name are managed by the operator itself.

    1. Retrieve all Kubernetes services within the monitoring namespace:


$ kubectl get service --namespace monitoring


    1. To list the DaemonSets in the monitoring namespace, execute the following command:


$ kubectl get daemonset --namespace monitoring 

Node Exporter: Node Exporter is a Prometheus exporter that collects hardware and operating system metrics from a target node in a Kubernetes cluster. It exposes metrics related to CPU usage, memory, disk usage, network activity, and other system statistics. Node Exporter is typically deployed as a DaemonSet in Kubernetes, which ensures that it runs on every node in the cluster. These metrics can then be scraped by Prometheus to monitor the performance and health of the nodes in the cluster.

    1. To display a list of deployments in the monitoring namespace, use the following command:


$ kubectl get deployments --namespace monitoring

In the Kubernetes deployments, you can find three main components: grafana, kube-prometheus-operator and kube-state-metrics.

      1. The prometheus-kube-prometheus-operator is the primary deployment created by Prometheus and the Alert Manager StatefulSet.
      2. Prometheus-grafana:It deploys Grafana with the operator and allows users to query, visualise, alert on, and explore their metrics data stored in Prometheus with the help of a GUI.
      3. Kube-state-metrics: This deployment helps to generate metrics about the state of various Kubernetes components, such as deployments, nodes, pods, and more. These metrics are then collected by Prometheus and can be used to monitor and analyse the health and performance of a Kubernetes cluster. 
    1. Retrieve the ReplicaSets in the monitoring namespace by executing the following command:


$ kubectl get replicaset --namespace monitoring


    1. Retrieve the StatefulSet in the monitoring namespace by executing the following command:


$ kubectl get statefulset  --namespace monitoring

Two statefulsets are deployed: one for the Alert Manager and the other for the Prometheus server.

What is an Alert Manager?

Alertmanager is a component in the Prometheus ecosystem that is responsible for handling alerts sent by client applications such as Prometheus server. It manages those alerts, groups them, and routes them to different receivers (such as email, Slack, PagerDuty, etc.) based on their labels and filtering rules.

What is Prometheus Server?

The Prometheus server is a core component of the toolkit that scrapes and stores time series data from monitored endpoints, and provides a query language and web UI for data analysis and visualisation. The server also supports alerting based on defined rules and threshold conditions.

    1. Port forward to get grafana:


$ kubectl port-forward deployment/prometheus-grafana 3000 -n monitoring

To access the Grafana dashboard, open http://localhost:3000 in your browser and use the default Grafana credentials, which can be obtained by following these steps.

    1. Obtain the Grafana username and port number by checking the container logs of the Grafana pod:


$ kubectl logs prometheus-grafana-55f68d49c5-cstfz -c grafana -n monitoring | grep -e 'Listen' -e 'default admin'


    1. The password can be decrypted from the Kubernetes secrets by using:


$ kubectl get secret prometheus-grafana -n monitoring -oyaml


    1. Decode the secret using base64 to retrieve its plaintext.


$ echo "cHJvbS1vcGVyYXRvcg==" | base64 --decode


    1. Login to the Grafana dashboard and retrieve Prometheus metrics:


To access the Prometheus UI, open http://localhost:9090 in your browser:

    1. Retrieve the port number for Prometheus from the container pod template using the following commands:


$ kubectl describe statefulset prometheus-prometheus-kube-prometheus-prometheus -n monitoring | grep -A 5 'Containers'


    1. To access the Prometheus server running on a pod, use port forwarding with the pod name and port:


$ kubectl port-forward prometheus-prometheus-kube-prometheus-prometheus-0 9090 -n monitoring


    1. Access the localhost using the designated port number on your browser.


Conclusion:

In a nutshell, deploying the Prometheus Operator to monitor Kubernetes clusters using Helm is a straightforward process. Helm allows us to easily install, upgrade, and manage the Prometheus Operator and its components, including Alertmanager and Grafana, with just a few simple commands. By following the steps outlined in this blog, you can quickly deploy and configure the Prometheus Operator, and start collecting and visualising metrics for your Kubernetes clusters. With the Prometheus Operator, you can gain valuable insights into your clusters’ health and performance, and make informed decisions to optimise their performance and reliability.

Looking for help with your Infrastructure or want help with your DevOps implementation strategy? Reach out to us and see how we can help.