Inside this article :
Introduction
Data has always been priceless, if it’s our application data forms of logs/metrics/traces – air and food for engineers like us to troubleshoot while trying to figure out why our pods are misbehaving. Observality comes into picture where our data needs to be collected, processed, analyzed and visualised, in short – to make data more ‘observable’. Not going too deep into the basics of o11y in this article, let’s pick up a familiar stack and discuss the common challenges we face. As the title says it all – we’ll discuss Prometheus, OpenTelemetry, and Grafana. First of to an overview how these tools work together and what they do…
How These Tools Work Together
Before diving into challenges, let’s quickly establish how these three pillars integrate:
The Observability Stack Architecture:
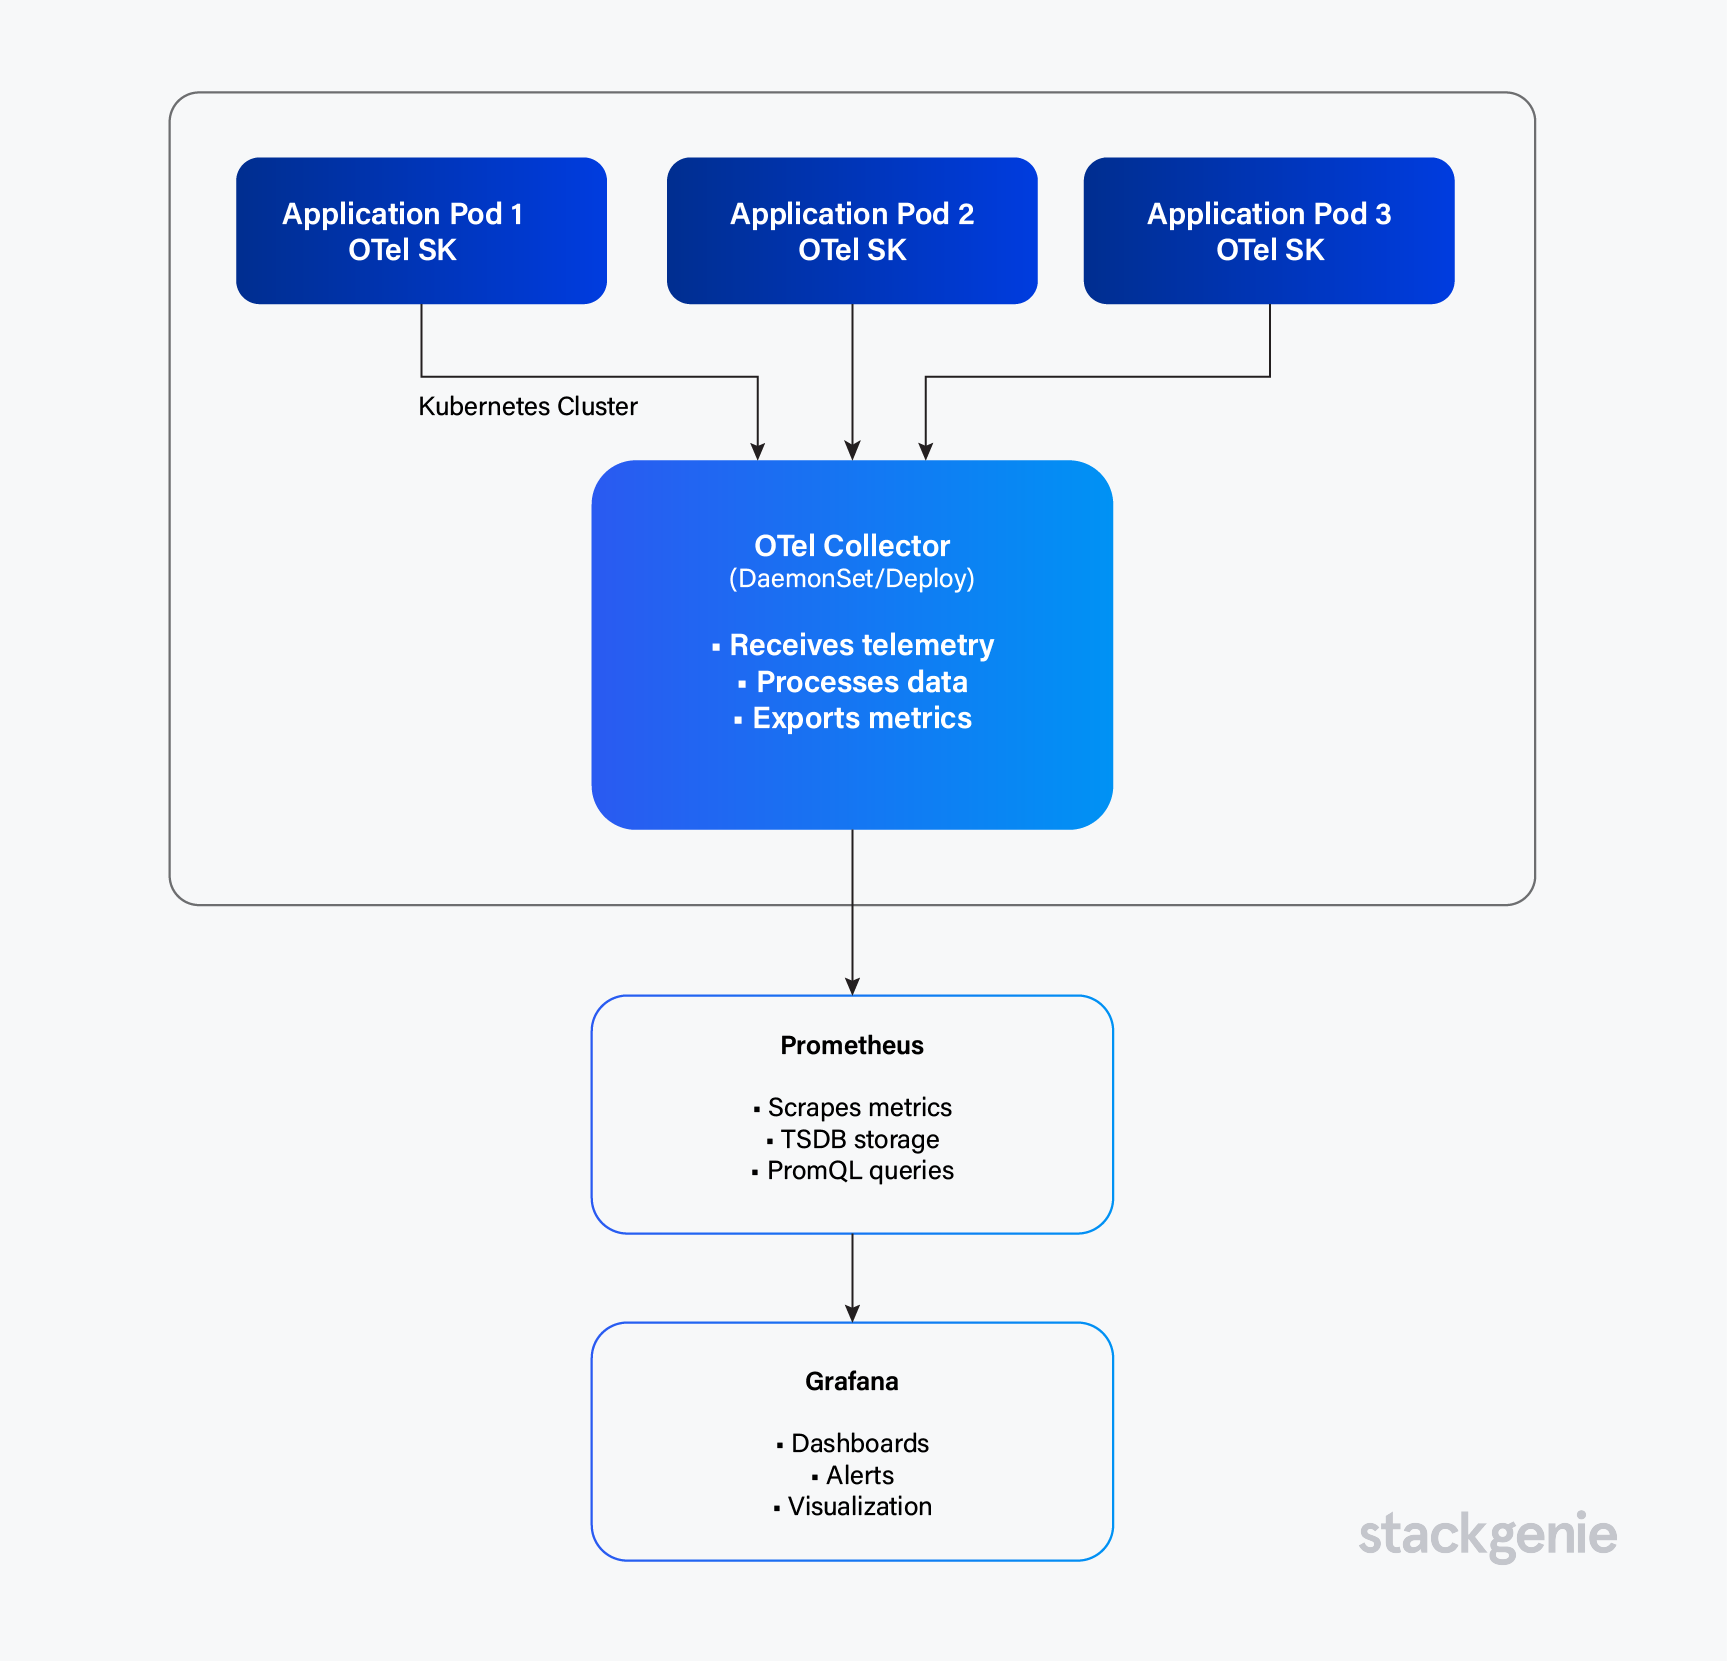
Prometheus is your metrics powerhouse. It scrapes endpoints, stores time-series data in its internal TSDB, and gives you PromQL to query everything. Think of it as the database and query engine for your metrics.
OpenTelemetry (OTel) is the universal translator. It standardizes how you collect traces, metrics, and logs from your apps. Instead of vendor-specific SDKs, you instrument once with OTel, and it can export to multiple backends. The Collector acts as a central processing hub—receiving, transforming, and routing telemetry data.
Grafana is your visualization layer. It connects to Prometheus (and other data sources), lets you build dashboards, and handles alerting. It’s where your ops team lives during incidents.
The flow is simple: Your apps emit telemetry via OTel SDK → OTel Collector processes it → Prometheus stores metrics → Grafana visualizes everything.
Common Challenges
1. Dashboard Usability and Design (Grafana)
- Underutilized metrics: Collecting hundreds of metrics but visualizing only a handful, adding cost without value.
- Non-technical accessibility: Dashboards built for engineers alienate stakeholders who need simple health indicators.
- Access control complexity: Multiple teams editing shared dashboards causes conflicts and configuration drift.
Solution: Create tiered dashboards for different audiences, use dashboard-as-code for version control, leverage variables to reduce sprawl.
2. Data Retention and Storage Limits (Prometheus)
- Limited default retention: Prometheus keeps data locally for 15 days. Historical analysis requires planning ahead.
- Scaling bottlenecks: Single Prometheus instances hit limits as metric volume grows. Federation adds complexity.
- Disk space constraints: High cardinality metrics can consume hundreds of GB rapidly.
Solution: Implement remote write to long-term storage (Thanos/Mimir), tune retention policies, monitor cardinality closely.
3. Configuration Synchronization
- Label and naming mismatches: OTel Collector and Prometheus use different label names, breaking queries.
- Metric format inconsistencies: Different naming conventions across teams make queries fragile.
- Version Compatibility Issues across components
- Configuring proper ports and endpoints.
4. Security and Data Privacy
- Unencrypted transmission: Metrics and traces flow in cleartext over the network.
- Missing authentication: Open metrics endpoints allow unauthorized access.
- PII leakage: Sensitive data accidentally added as labels or attributes.
Solution: Enable mTLS for OTel and Prometheus, implement auth for scrape targets, sanitize PII with OTel processors, apply network policies.
5. Remote Storage Costs
- Cardinality explosion: High-cardinality labels multiply storage costs rapidly.
- Over-retention: Keeping high-resolution data long-term is expensive.
- Data transfer charges: Remote write generates continuous egress costs.
Solution: Control cardinality strictly, implement tiered retention with down sampling, drop unnecessary metrics, use recording rules, monitor costs with alerts.
Final Thoughts
Observability isn’t just about using tools—it’s about making data meaningful. The challenges we discussed apply to any stack: proper instrumentation, naming, cardinality control, security, and usable dashboards.
O11y is valuable when best practices are part of our workflow, not an afterthought. The goal isn’t just to collect data, but to gain insight that makes our systems—and our work—better.
Frequently Asked Questions (FAQs)
1. How do Prometheus, OpenTelemetry, and Grafana work together for Kubernetes observability?
Applications emit telemetry via OpenTelemetry (SDK or auto-instrumentation) to the OTel Collector, which processes and routes data. Prometheus scrapes metrics endpoints and stores time-series data in its TSDB. Grafana connects to Prometheus (and other sources) to visualize dashboards and handle alerting. Together, they create a full pipeline for consistent data collection, storage, and visualization across Kubernetes clusters.
2. What are the most common Kubernetes observability challenges?
Common challenges include limited data retention in Prometheus, dashboard sprawl, configuration mismatches between OTel and Prometheus, security risks such as open metrics endpoints, and cost issues from high-cardinality metrics. These can be mitigated by using dashboard-as-code, remote write with Thanos or Mimir, strict naming standards, and enabling mTLS or authentication for metrics endpoints.
3. How can I scale Prometheus data retention without losing performance?
Use remote write to long-term storage backends like Thanos or Grafana Mimir. Apply tiered retention with downsampling, create recording rules for common queries, and limit metric cardinality. This helps keep your local Prometheus instances lean while preserving historical data for analytics.
4. How do I control observability costs caused by high metric cardinality?
Restrict label usage at source, avoid dynamic labels like user IDs or URLs, use the OTel Collector to relabel or drop unneeded metrics, and monitor cardinality growth proactively. Implement downsampling and shorter retention for high-frequency data to keep costs predictable.
5. How can teams standardize labels and metrics naming across Kubernetes environments?
Adopt a shared metrics taxonomy across services, define naming conventions (snake_case, units, label keys), and enforce them via CI/CD checks. Use the OpenTelemetry Collector to normalize metric names and labels. Consistency prevents broken dashboards and improves query reliability across clusters.